About one in three American adults sleeps less than seven hours a night, and that number has barely moved in a decade. If you came here looking for a figure to quote, that's the one most worth knowing.
What follows is 100 sleep statistics pulled from federal health surveys, sleep medicine bodies and peer-reviewed research. Every one carries its source and the year the data was collected, because a lot of the numbers circulating online are a decade old and presented as current. Where researchers disagree, we say so rather than picking the tidier answer.
How much sleep do Americans actually get?
Just over 30% of US adults sleep less than seven hours a night, which is the minimum the American Academy of Sleep Medicine recommends. The figure comes from the 2024 National Health Interview Survey and has stayed roughly flat since 2020, despite the explosion in sleep trackers, supplements and mattress marketing over the same period.
The gap between numbers 1 and 4 is not a trend. The two surveys ask different questions and draw the line in different places. If you only want one figure, use 30.5% and name the year.
How many people wake up feeling rested?
Slightly more than half. Duration and quality are different things, and the federal data now tracks both. One pattern stands out: trouble *falling* asleep is a younger-adult problem, while trouble *staying* asleep gets worse with age.
Who sleeps worst in America?
Black adults have by a clear margin the highest rate of short sleep, and Asian adults report the best sleep on every measure the CDC tracks. The worst age band is middle age rather than old age, which surprises most people.
How common is sleep apnea?
Far more common than diagnosis rates suggest. Estimates of how many Americans have obstructive sleep apnea have risen sharply in recent years, largely because researchers use a broad diagnostic threshold. The finding that holds up regardless of method is that most cases go undetected.
A caution on number 17: that estimate uses a generous diagnostic threshold and comes from a single study with industry ties. Treat it as an upper bound, not a settled fact.
How many people have insomnia?
Between 5% and 15% of adults meet the criteria for chronic insomnia disorder, while a much larger share experience insomnia symptoms at some point. The treatment picture is clearer than the prevalence one: therapy outperforms medication over the long run, and every major sleep body says so.
What percentage of adults snore?
Somewhere between a quarter and half, depending entirely on how you define snoring. This is one of the widest ranges in sleep research, and any page quoting a single confident figure is hiding the definitional problem.
How common are restless legs, narcolepsy and sleepwalking?
Narcolepsy is genuinely rare, at roughly four people in every 10,000. Restless legs syndrome and sleepwalking both carry enormous published ranges, because prevalence depends on how strictly researchers screen out look-alike conditions.
What actually happens while you sleep?
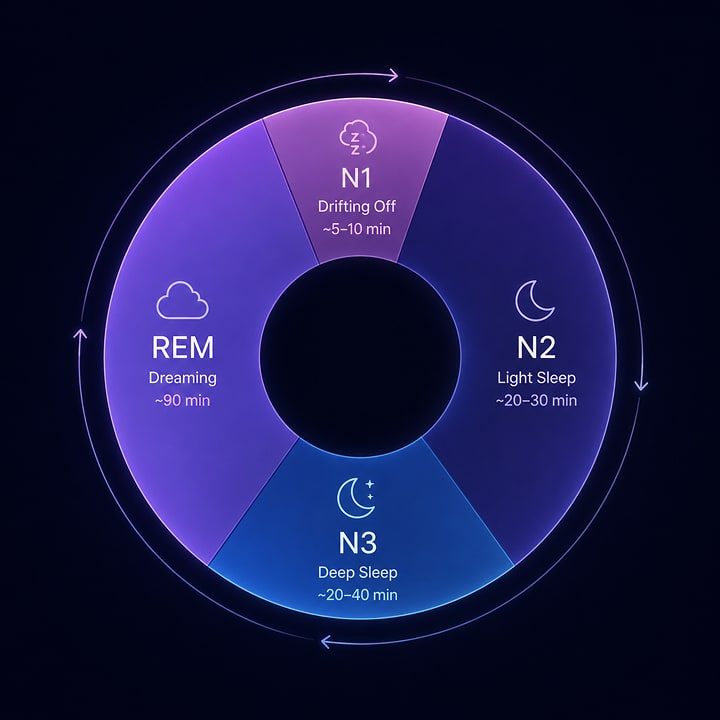
You move through cycles of roughly 90 minutes, alternating between three stages of non-REM sleep and REM. Deep sleep is front-loaded into the early cycles and REM into the later ones, which is why the last few hours of a night matter more than people assume.
How does sleep affect physical health?
Enough that the American Heart Association added it to its core checklist of cardiovascular health measures in 2022. The most persuasive evidence is a randomised trial showing that simply sleeping longer changed how much people ate, without any other instruction.
Is there a link between sleep and dementia?
The best evidence comes from a British cohort followed for 25 years, which found that consistently sleeping six hours or less in midlife was associated with about a 30% higher dementia risk. Association is not causation, and the researchers were careful about that.
The obvious objection is reverse causation, since early dementia disrupts sleep. The authors addressed it partly by measuring sleep more than two decades before typical onset, and the association did weaken at age 70, which is roughly what you'd expect if some of those cases were already underway.
How much sleep do teenagers get?
Less than at any point on record. Fewer than a quarter of US high school students get the eight hours the AASM recommends, down from nearly a third a decade ago. California's mandated later start times are the closest thing to a controlled experiment, and the first results arrived this month.
Number 58 comes from a working paper that has not yet been peer reviewed, and at least one summary of the same research reported weaker academic effects. The sleep finding is the solid part.
How much sleep do babies and children need?
It depends heavily on age, and the AASM publishes banded recommendations endorsed by the American Academy of Pediatrics. On infant safe sleep, the news this year is not good: the sudden unexpected infant death rate has started rising again after two decades of no progress.
How does pregnancy affect sleep?
Sleep problems become the norm rather than the exception, and they worsen through the third trimester. The hardest period, though, is not pregnancy itself. It's the first month after delivery.
What does sleep loss cost?
The standard estimate is up to $411 billion a year in the US, or about 2.28% of GDP. It comes from a RAND analysis that is now a decade old and has never been updated, so date it whenever you use it. The road safety numbers are fresher, and they contain the single most striking discrepancy in this entire field.
How many Americans take something to help them sleep?
About one in eight uses a sleep aid most nights. The newest federal data splits that into prescription drugs, over-the-counter products and cannabis, and the cannabis figure behaves differently from the rest.
Do sleep trackers and sleeping apart actually help?
About half of American adults track their sleep with some device, and a measurable minority end up anxious about the numbers. Roughly a third have slept separately from a partner to get better rest, and it peaks in midlife rather than old age.
Does a dark, quiet, cool bedroom really matter?
Darkness has the strongest evidence behind it, and it's newer and more serious than most people realise. Two 2024 studies using wrist light sensors on around 89,000 people linked brighter nights to higher mortality and higher diabetes risk, in a dose-dependent way.
On temperature, the widely repeated "65°F is ideal" figure has no traceable source, so we've left it out. What the research does show is that in adults over 65, bedroom temperatures above 24°C were associated with signs of physiological stress overnight.
How long before bed should you stop caffeine and alcohol?
Six hours for caffeine, and three to four for alcohol. Both have a similar catch: people consistently fail to notice the disruption they cause, which is why self-assessment is a poor guide here.
A note on daylight saving time and shift work
Two claims you'll see repeated as settled are genuinely contested, and it's worth knowing before you quote them.
On clock changes: older studies found a spike in heart attacks after springing forward, including a 24% rise on the Monday following the switch in a Michigan hospital analysis. But the largest study yet, published in *JAMA Network Open* in September 2025, examined 168,870 hospital visits across more than 1,100 hospitals and found no significant difference in heart attack rates around either transition. It used Arizona and Hawaii, which don't observe daylight saving, as controls. The AASM's position remains that the US should abolish seasonal clock changes in favour of permanent standard time.
On night work: the International Agency for Research on Cancer classified night shift work as probably carcinogenic in 2019, a judgement resting substantially on animal and mechanistic evidence, with human epidemiological evidence described as limited. A meta-analysis of ten prospective studies covering 4,660 breast cancer cases found little or no effect on breast cancer incidence. Both findings are real.
Frequently asked questions
What percentage of Americans are sleep deprived?
About 30.5% of US adults sleep less than the recommended seven hours, according to CDC data collected in 2024 and published in April 2026. A separate CDC analysis using a six-hour cut-off puts it at 33.2%. Both point to roughly one in three.
Has American sleep been getting worse over time?
Adult sleep has been broadly flat since 2020, hovering around 30% getting insufficient sleep. Teen sleep is a different story: the share of high school students getting eight hours fell from 32% in 2013 to 23% in 2023, according to the CDC's Youth Risk Behavior Survey.
How many people have undiagnosed sleep apnea?
Roughly 80% of US sleep apnea cases are thought to be undiagnosed, with published estimates of underdiagnosis ranging from 80% to 98%. Total prevalence estimates vary widely depending on the diagnostic threshold used, so the undiagnosed share is the more reliable figure.
Which sleep statistics are most often quoted incorrectly?
Three stand out. The "72% of high schoolers" figure comes from 2015 data. The $411 billion economic cost is a 2016 RAND estimate that was never updated. And the common claim that 65°F is the ideal bedroom temperature has no identifiable primary source.
Do sleep trackers improve your sleep?
For some people. Around 48% of US adults use one, according to a 2025 AASM survey. But between 3% and 14% show signs of orthosomnia, where anxiety about the sleep score itself starts interfering with sleep.
Where these numbers come from
Every statistic on this page carries a year and a named source. Almost all of them are primary sources, meaning the agency that collected the data or the journal that first published the finding, rather than another statistics roundup quoting a third party.
Three rules shaped what made it in. Where a figure rests on a single study, we hedged the language. Where credible research disagrees, we gave both sides instead of picking the tidier one. And where a widely repeated number could not be traced back to a real source, we left it out and said so.
Federal and international health agencies
- Centers for Disease Control and Prevention, National Center for Health Statistics: National Health Interview Survey, reported in Data Brief No. 559 and Health E-Stat No. 116 (both April 2026)
- CDC Behavioral Risk Factor Surveillance System, analysed in the CDC journal Preventing Chronic Disease
- CDC Youth Risk Behavior Survey, Data Summary and Trends Report 2013–2023
- CDC Morbidity and Mortality Weekly Report, on sudden unexpected infant death (September 2026)
- National Health and Nutrition Examination Survey (NHANES)
- National Institute of Neurological Disorders and Stroke, Brain Basics: Understanding Sleep
- National Highway Traffic Safety Administration
- Office of Disease Prevention and Health Promotion, Healthy People 2030
- World Health Organization, Guidelines for Community Noise
- International Agency for Research on Cancer
Medical bodies and research institutions
- American Academy of Sleep Medicine, including its pediatric and adult consensus statements, clinical practice guidelines, and 2025 Sleep Prioritization Survey
- Sleep Research Society
- American Academy of Pediatrics
- American Heart Association, Life's Essential 8
- American College of Physicians
- American Medical Association
- AAA Foundation for Traffic Safety
- RAND Corporation
Peer-reviewed journals
- Science, Cell, Proceedings of the National Academy of Sciences, Nature Communications
- JAMA, JAMA Internal Medicine, JAMA Network Open, JAMA Otolaryngology–Head & Neck Surgery
- The Lancet Regional Health – Europe
- SLEEP, Journal of Clinical Sleep Medicine, Sleep Medicine
- Frontiers in Medicine, Current Psychiatry Reports, Brain Sciences
Two long-running cohort studies do a lot of the heavy lifting in the health sections: UK Biobank, which supplied the light exposure and brain imaging findings, and Whitehall II, the British civil service study behind the dementia figures.
If you act on one thing here, make it the darkness. Most sleep advice asks you to change a habit, and habits are hard. Getting your bedroom properly dark takes one evening and a decent pair of curtains.